| Models: | GFS | GME | GEM | JMA | NGP | Ensembles: | GFS | GFS ZR | MOD | Fronts: | UKMO | NWS | USAF | Upper Air Data: | Temps |
| CAPE: Convective available potential energy GMT = Greenwich Mean Time |
| |
|
| RH 300 hPa: Relative Humidity at 300 hPa This chart shows the relative humidity at 300 hPa, which is equivalent to an altitude of about 30.000 ft a.s.l. depending on the SLP. With the help of this map one is able to draw conclusions on the portion of the sky cover formed by high-level cirrus clouds. GMT = Greenwich Mean Time |
| |
|
|
| Isotachs 10m This map shows isotachs - lines on a given surface connecting points with equal wind speed - together with isobars - the line of equal atmospheric pressure over the British Isles at 10m above the ground. The unit used is kph (kilometers per hour). GMT = Greenwich Mean Time |
| |
|
|
|
The Lifted Index (LI) is defined as a rising parcel's temperature when it reaches the 500 millibars level (at about 5,500m or 18,000 feet asl), subtracted from the actual temperature of the environmental air at 500 mbar. If the Lifted Index is a large negative number, then the parcel will be much warmer than its surroundings, and will continue to rise. Thunderstorms are fueled by strong rising air, thus the Lifted Index is a good measurement of the atmosphere's potential to produce severe thunderstorms.
GMT = Greenwich Mean Time |
||||||||||||||||||||||||||||||||||||||||
| |
|
|
| NH Precipitation: GMT = Greenwich Mean Time |
| |
|
|
| NH SLP: GMT = Greenwich Mean Time |
| |
|
|
| NH T 850 hPa: GMT = Greenwich Mean Time |
| |
|
|
| NH z 500 hPa: GMT = Greenwich Mean Time |
| |
|
|
| Precip BI: Precipitation across the British Isles. The map 'Precip BI' shows the precipitation across the British Isles modeled over every 6 hours. The model does not forecast the exact amount of precipitation for every location. However, this chart is an important tool for forecasting intensity and local distribution of precipitation qualitatively. GMT = Greenwich Mean Time |
| |
|
|
| Precipitation: Precipitation across Europe in mm (or litres per square metres) The precipitation map - updated every 6 hours - shows the modeled precipitation in mm over the entire North-Atlantic and European region. The precipitation areas are encircled by isohyets - lines with equal amounts of precipitation. However, modeling precipitation is still not very reliable. If you compare the modeled results with observed values you will realize that the model is nothing better than a first order approach. Yet this chart is of some use for forecasters. Note: Based on international convention meteorologists use the metric system. 100 mm of precipitation is equivalent to roughly 4 inches. GMT = Greenwich Mean Time |
| |
|
|
| SLP: The surface chart. Sea Level Pressure in hPa The surface chart (also known as surface synoptic chart) presents the distribution of the atmospheric pressure observed at any given station on the earth's surface reduced to sea level. You can read the positions of the controlling weather features (highs, lows, ridges or troughs) from the distribution of the isobars (lines of equal sea level pressure). The isobars define the pressure field. The pressure field is the dominating player in the weather system. Additionally, this map helps you to identify synoptic-scale waves and gives you a first estimate on meso-scale fronts. GMT = Greenwich Mean Time |
| |
|
|
| Fronts SLP Isobars in hPa (solid lines) Isolines for equivalent potential temperature at 850 hPa (dashed and coloured) The equivalent potential temperature is calculated from the specific humidity (ratio of mass of the water vapor to the total mass of the system) and the temperature, both at 850 hPa. Therefore, from this map one can read the fronts even better than from the 'RH 700 hPa' or other maps. GMT = Greenwich Mean Time |
| |
|
|
| RH 700 hPa: Relative Humidity at 700 hPa This chart shows the relative humidity at 700 hPa. In the forefield of a trough line as well as at and near fronts (Jets), warmer less dense air is forced to ascend. As the ascending air cooles, the relative humidity increases, eventually resulting in condensation and the formation of clouds.This process is known as frontal lifting. High relative humidity at 700 hPa - equivalent to ca. 10,000 ft a.s.l. - indicates the areas of frontal lifting and thus the active zones of the current weather. GMT = Greenwich Mean Time |
| |
|
|
| RH 925 hPa: Relative Humidity at 925 hPa This chart shows the relative humidity at 925 hPa, which is equivalent to an altitude of about 2100 to 2500 ft a.s.l. depending on the SLP. With the help of this map one is able to draw conclusions on the portion of the sky cover formed by low-level stratocumulus clouds. Stratocumulus cover is particularly hard to forecast on the backside of a trough. Therefore the 'RH 925 hPa' is an essential supplementation to the 'RH 700 hPa' map. GMT = Greenwich Mean Time |
| |
|
|
GMT = Greenwich Mean Time |
||||||||||||||||||||||||||||||||||
| |
|
|
| RH 0-300: Mean relative humidity between 0 and about 300 m above the ground level This chart shows the mean relative humidity for the atmospheric layer between 0 and 300m. Although this map is less important than RH-charts (like 925 hPa or 700 hPa) it still gives some useful hints on very shallow humidity inversions and thus temperature inversions. GMT = Greenwich Mean Time |
| |
|
|
| RH 600-3000: Mean relative humidity between ca. 600 and 3000m above the ground level This map presents the average relative humidity between about 600 and 3000m above the ground - equivalent to the atmospheric layer between 2000 and 10000ft. Although this map is by far not as important as the 'RH 700 hPa' or the 'RH 925 hPa', it gives some hints on cloud formation especially between these two pressure altitudes. GMT = Greenwich Mean Time |
| |
|
|
| RH 3000-6000: Mean relative humidity between ca. 3000 and 6000 m above the ground. This map presents the mean relative humidity between about 3000 and 6000m a.s.l. - equivalent to the atmospheric layer between 10,000 and 20,000 ft. This is the atmospheric region where middle and high stratus clouds form. They are typically fringing a warm ridge along the anticyclonic sector of a frontal zone. In general, middle and high stratus clouds are a good indicator for the run of the jet stream. Mean Relative Humidity in the layer between about 600 and 3000 m above ground GMT = Greenwich Mean Time |
| |
|
|
| Storm: Sea Level Pressure (solid lines) Wind speed 10m in Beaufort (colored) GMT = Greenwich Mean Time |
| |
|
|
| T 500 hPa: Temperature (°C) at 500 hPa. GMT = Greenwich Mean Time |
| |
|
|
| z T 850 hPa: Geopotential height (tens of m) at 850 hPa (solid line). Temperature (°C) at 850 hPa (coloured, dashed line). This chart helps to identify areas of densely packed isotherms (lines of equal temperature) indicating a front. Aside from this you can use the modeled temperature in 850 hPa (5000 ft a.s.l.) to make a rough estimate on the expected maximum temperature in 2m above the ground. However, this method does not apply to (winter) inversions. GMT = Greenwich Mean Time |
| |
|
|
| T 850 hPa: Temperature (°C) at 850 hPa. GMT = Greenwich Mean Time |
| |
|
|
| T-Adv 500: Temperature advection across the Pacific in K/6h (colored lines) Geopotential in 500 hPa (solid, black lines) The map "T-Adv 500" shows the advection of cold or warm air at 500 hPa level. Negative values indicate cold advection, while positive values indicate warm air advection. Advection of warm or cold air causes the geopotential height to respectively rise or drop, producing vertical rising and sinking motion of air. There is, however, not a direct relationship between temperature advection and resultant vertical motion in the atmosphere since other lifting and sinking mechanisms can complicate the picture, e.g. vorticity advection (see "V-Adv maps"). In weather forecasting, temperature advection maps are often used to locate the postion of wam and cold fronts. Cold advection is common behind cold fronts, while warm advection is common behind warm fronts and ahead of cold fronts. Higher in the atmosphere temperature advection is getting less pronounced, as horizontal much more uniform in temperature and the flow is more zonal. GMT = Greenwich Mean Time |
| |
|
|
| T-Adv 850: Temperature advection across the Pacific in K/6h (colored lines) Geopotential in 850 hPa (solid, black lines) The map "T-Adv 850" shows the advection of cold or warm air at 850 hPa level. Negative values indicate cold advection, while positive values indicate warm air advection. Advection of warm or cold air causes the geopotential height to respectively rise or drop, producing vertical rising and sinking motion of air. There is, however, not a direct relationship between temperature advection and resultant vertical motion in the atmosphere since other lifting and sinking mechanisms can complicate the picture, e.g. vorticity advection (see "V-Adv maps"). In weather forecasting, temperature advection maps are often used to locate the postion of wam and cold fronts. Cold advection is common behind cold fronts, while warm advection is common behind warm fronts and ahead of cold fronts. Higher in the atmosphere temperature advection is getting less pronounced, as horizontal much more uniform in temperature and the flow is more zonal. GMT = Greenwich Mean Time |
| |
|
|
|
GMT = Greenwich Mean Time |
| |
|
|
| TMax 2m: Maximum Temperature at 2 metres above the ground This map shows the highest temperature, as expected by the ANV-model, between 6 to 12 and 12 to 18 UTC. Though the modeled 2m-temperature often is not in agreement with the actual observation, together with 1. the temperature at 850 hPa, 2. SYNOP reports 3. and a skillful synoptic meteorologist, excellent TMax 2m forecasts are possible. GMT = Greenwich Mean Time |
| |
|
|
| TMin 2m: Minimum Temperature at 2 metres above the ground This map shows the lowest temperature, as expected by the ANV-model, between 6 to 12 and 12 to 18 UTC. Though the modeled 2m-temperature often is not in agreement with the actual observation, together with 1. the temperature at 850 hPa, 2. SYNOP reports 3. and a skillful synoptic meteorologist, excellent TMin 2m forecasts are possible. GMT = Greenwich Mean Time |
| |
|
|
| Fronts Thickness Isolines (solid lines) Isolines for equivalent potential temperature at 850 hPa (coloured lines) The equivalent potential temperature is calculated from the specific humidity (ratio of mass of the water vapor to the total mass of the system) and the temperature, both at 850 hPa. Therefore, from this map one can read the fronts even better than from the 'RH 700 hPa' or other maps. GMT = Greenwich Mean Time |
| |
|
|
| Wind 10 m: Wind 10 meters above the ground This chart displays the modeled average wind vector in 10 m above the ground for every grid point of the model (ca. every 80 km). In general, the actual observed wind velocity at 10 m above ground is a little bit lower than the modeled one. However, usually the computed wind velocity is pretty close to the reality. Therefore this chart is very useful for sailors, gliders, hang gliders and balloon pilots. GMT = Greenwich Mean Time |
| |
|
|
| NH Wind 300 hPa: GMT = Greenwich Mean Time |
| |
|
|
| Wind 850 hPa: Wind at 850 hPa This map presents the average wind vector at 850 hPa for every modeled gridpoint (ca. 80 km). The average pressure altitude for 850 hPa is at about 1500m a.s.l. (5000 ft). One can read its present altitude from the 'z T 850 hPa' chart. This map is very useful for gliders and hang-gliders if their airfield or starting pad is significantly below the 850 hPa pressure altitude. GMT = Greenwich Mean Time |
| |
|
|
| Wind 900 hPa: Wind at 900 hPa This map shows the average wind vector at 900 hPa for every modeled gridpoint (ca. 80 km). Based on the average SLP of about 1010 hPa the equivalent pressure altitude for 900 hPa would be at about 900m a.s.l. (ca. 3000 ft). This map is very useful for gliders and hang-gliders, if their airfield or starting pad is at a low altitude. GMT = Greenwich Mean Time |
| |
|
|
| V-Adv 500: Vorticity advection across the Pacific in 105/(s*6h) (colored lines) Geopotential in 500 hPa (solid, black lines) The two types of vorticity advection are positive (PVA) and negative vorticity advection (NVA). 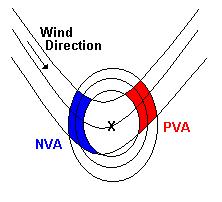 The closed circles in the figure show the 500 hPa absolute vorticity
lines, the others the 500 hPa height lines. When an air parcel is moving from
an area higher vorticity to an area lower vorticity this is called: PVA
(red color). The other way around is called: NVA (blue color). PVA is
associated with upper-air divergence, i.e. upward vertical motion. NVA
is associated with down ward vertical motion. Therefore, PVA at 500
hPa is strongest above a surface low, while NVA at 500 hPa is strongest
above a surface high.
The closed circles in the figure show the 500 hPa absolute vorticity
lines, the others the 500 hPa height lines. When an air parcel is moving from
an area higher vorticity to an area lower vorticity this is called: PVA
(red color). The other way around is called: NVA (blue color). PVA is
associated with upper-air divergence, i.e. upward vertical motion. NVA
is associated with down ward vertical motion. Therefore, PVA at 500
hPa is strongest above a surface low, while NVA at 500 hPa is strongest
above a surface high. In operational meteorology Vorticity advection maps are used to identify areas with vertical air motion to see where clouds, precipitation or clear conditions are likely to occur. Keep in mind, however, that PVA is not the same as upward vertical motion. Here temperature advection is important too. GMT = Greenwich Mean Time |
| |
|
|
|
GMT = Greenwich Mean Time |
| |
|
|
|
GMT = Greenwich Mean Time |
| |
|
|
| z T 500 hPa: Geopotential height at 500 hPa (solid line) Temperature at 500 hPa (colored, dashed) The maps show the predominant tropospheric waves (trough or ridge). They virtually control the "weather" (dry, warm / wet, cold) and the long waves drive the smaller synoptic waves. Thus, this upper-level chart illustrates the dynamics of our atmosphere. GMT = Greenwich Mean Time |
| |
|
|


